 |
This article originally appeared in Geospatial Solutions Magazine's Net Results column of September 1, 2003. Other Net Results articles about the role of emerging technologies in the exchange of spatial information are also online. |
| 1. Introduction and Glossary 2. Whether, Not When 3. Practical Theory 4. Future Directions | |
| Practical theory While some of the symposiumĺs presenters focused on purely theoretical spatio-temporal issues Ś such as query methods or index performance comparisons Ś others have tightly coupled their research to specific real-world applications, such as astronomy, tourism, or LBS. Galactic geometry. In a presentation titled ôCross-Outlier Detection,ö Spiro Papadimitriou of Carnegie Mellon Universityĺs Computer Science Department explained that the common approach to discovering suspicious spatial data (also known as outliers) is to search within a single set of observations for those that deviate from the norm. Recognizing the limitations of the single-set approach, Papadimitriou has extended the range of analytical tools with techniques for examining two datasets against each other. One of his test cases involves astronomical data which, he explained, may involve multiple types of inter-related galaxies. For instance, referencing 993 spiral galaxies to 1,218 elliptical galaxies (see Figure 4) reveals a phenomenon that would not make sense if the two datasets were analyzed independently. Namely, in Papadimitriouĺs words, ôelliptical galaxies form clusters, intertwined with clusters of spiral galaxies. The distribution is overall even; however, a few of the elliptical galaxies are within unusually dense clusters of spiral galaxies.ö As with density queries, the concept of multiset outlier detection is simple enough, but the implementation is complex.
|
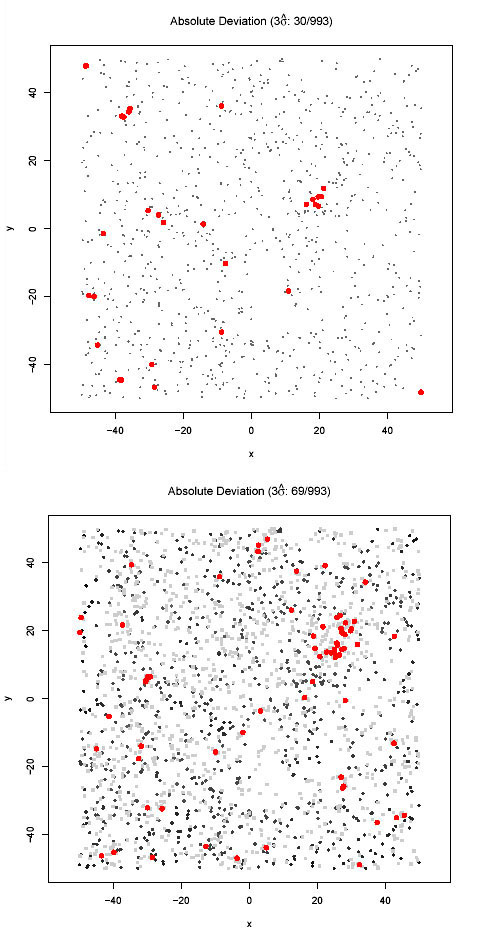
FIGURE 4: Elliptical and spiral galaxy datasets
from the Sloan Digital Sky Survey are one of Papadimitriouĺs real-world test cases
for multiset outlier detection. At top, ôplainö (single-set) outliers are
red points. At bottom, multi-set analysis reveals red crossoutlier points. |
| Off the (Berlin) wall. Closer to home is
LBS research by three professors interested in how to supply mobile PDAs with
the right data at the right time, no more, no less. Agnes Voisard, from Fraunhofer
Insitut fŘr Software und Systemtechnik in Berlin, Germany, is prototyping an LBS
application with ôricher and more targeted informationö than the typical
ôfastest route to the nearest drugstoreö approach. In preparation for deployment
at the 2008 Olympics in China, Voisard is prototyping a TIP that provides information
to mobile devices and keeps a history of previous communications in order to
avoid unwanted duplication of messages. Voisard describes how her focus differs from traditional LBS applications as follows: ôWe are concerned here with applications involving mobile end users who already acquired knowledge on a particular area and who would like to get more information at a certain location, at a certain time, on particular topics and to relate pieces of information (current and past) with each other.ö To accomplish this, TIP captures a history of pages visited and steadily builds a profile of the user. Her system also hinges on an event notification system that informs tourists of concerts, plays, and other occurrences Ś either to suggest attendance or report cancellations. In other words, users get information they may not have explicitly asked for if their profiles suggest that they might be interested. To simulate how such a system would work, Voisard has created a scenario of a day in the life of a fictional user touring Berlin (see Figure 5). |
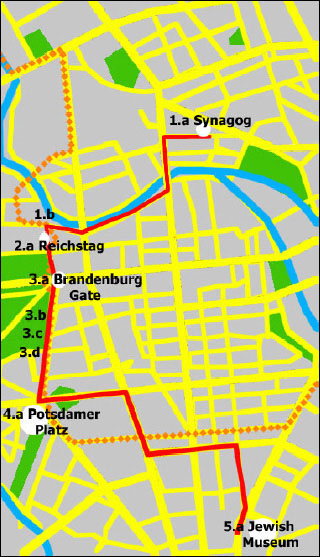
FIGURE 5 Voisardĺs fictional tourist
follows a trajectory through Berlin, |
| Over the course of the touristĺs stroll,
the PDA reports facts based on nearby landmarks, and suggests a philharmonic
concert and places for lunch based on the userĺs profile (see
Figure 6).
|
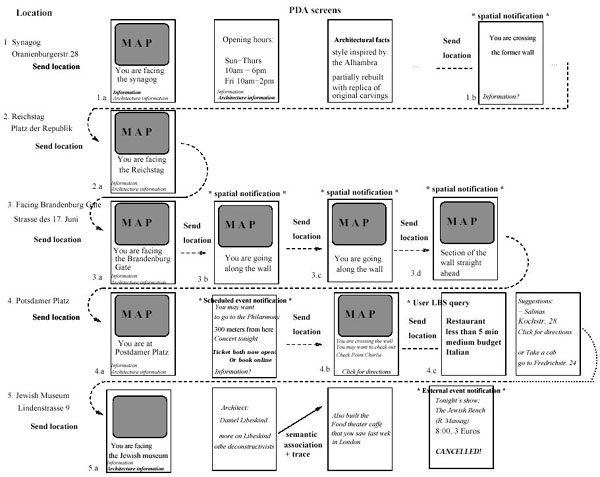
FIGURE 6 A day in the life of a tourist unfolds
in a series of screens on a PDA. |
| Que sera? Voisard explicitly notes that her concern is with the interface and
content of a mobile PDA application, not with underlying content delivery mechanisms.
Not to worry. Two professors of computer science, Jensen (Aalborg University),
and Ouri Wolfson (University of Illinois) have delved deeply into just this
topic. Both recognize the need to supply moving PDAs with map updates more
efficiently than periodic updates (such as every two minutes). Their parallel research efforts indicate that if a map server guesses a moving objectĺs future path, the efficiency of communications between server and PDA increases dramatically. The challenge is to keep the prediction roughly in sync with reality, readjusting when error exceeds a threshold. Jensen illustrated this approach with a series of animated slides in which a moving vehicle stopped in traffic or took an unexpected route (see Figures 7aľg). In both cases, the central server recognized the irregularity and adjusted its prediction accordingly, in real time.
|
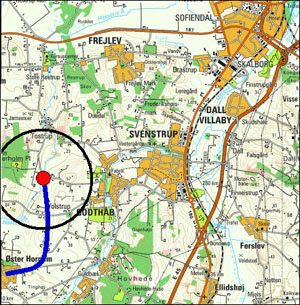
FIGURE 7a Efficient updates require a
predicted route: As the vehicle (red point) begins its journey, the map server guesses
its intended route (blue line). |
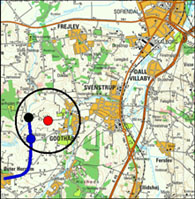
FIGURE 7b The anticipated vehicle location
(blue point) doesnĺt match its actual location (red point). |
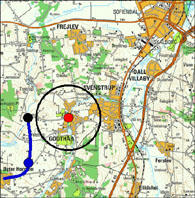
FIGURE 7c Predicted and actual vehicle locations
differ enough to signal a recalibration of the model. |
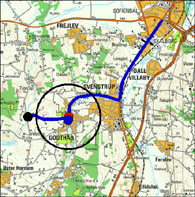
FIGURE 7d The map server recalculates the predicted
route (new blue line) based on the vehicleĺs actual behavior (red point). |
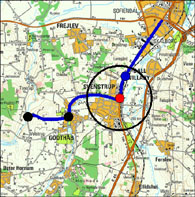
FIGURE 7e Now the real vehicle (red point) is
stopped in traffic, but its predicted location (blue point) surges ahead. |
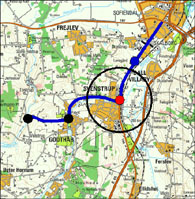
FIGURE 7f The prediction (blue point) gets out of
synch with reality (red point) again, so... |
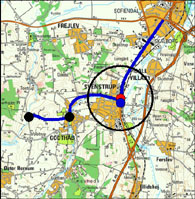
FIGURE 7g ...the prediction recalibrates the
virtual vehicle location (blue point) with the real one (red point), but leaves
the route (blue line) as is. |
| 1. Introduction and Glossary 2. Whether, Not When 3. Practical Theory 4. Future Directions |
|
|