 |
This article originally appeared in Geospatial Solutions Magazine's Net Results column of September 1, 2003. Other Net Results articles about the role of emerging technologies in the exchange of spatial information are also online. |
| 1. Introduction and Glossary 2. Whether, Not When 3. Practical Theory 4. Future Directions | |
| Whether, not when Because this was my first exposure to a truly academic spatio-temporal symposium, I wasn’t sure what to expect. By the second day of presentations, though, the subtle differences between research symposia and commercial conferences was apparent. In vendor-driven events, the latest product release gets (hopefully) kudos from the crowd, which has long been clamoring for some new functionality. In research symposia, however, a fully realized idea wins respect and acclaim. Christian S. Jensen, a professor in Denmark’s Aalborg University, Department of Computer Science, put it this way: “As an academic, I don’t have to worry about when a technology [such as LBS] becomes real; I only care whether, someday, it does.” Jensen strives to craft complete, rigorously tested ideas, not necessarily working products. The results of such research may become components of larger commercial systems. In fact, the high quality and thoroughness of academic research attracts industry representatives who hope to save internal development time by turning good research ideas into products. Though most researchers want their findings to be put to use by industry, at heart they first want to understand every aspect of their chosen problem domain without the distractions of a product release schedule or the need to design a fully functional system. Coming up with a clear problem definition is thus an important part of the researcher’s art. Sanjay Chawla, a professor at Australia’s University of Sydney, School of Information Technologies, explained that good research identifies a very specific problem, explores all of its possible manifestations, suggests a solution, and benchmarks the spectrum of best- and worst-case performance by that solution. The importance of clear problem definition encourages researchers to explain their ideas precisely, not only with words, but with mathematical equations, graphs, tables, illustrations, and sometimes even their own invented abstract symbology. Clear communication of complex ideas becomes an art unto itself. For example, consider the problem of interval relationship queries. Most commercial databases do not efficiently handle queries comparing one time interval to another, such as searching for employees whose scheduled vacations overlap the month of March. A vacation interval and the month of March are both known time intervals and therefore will have any one of 13 possible relationships. In the course of explaining his method for indexing and querying such time intervals, Lars Arge, professor of Computer Science at Duke University, diagrams 12 of those relationships using symbols, mathematical equations, and graphs (see Figure 1). (The 13th relationship [not appearing in Arge’s diagram] is the “equals” case, in which both intervals are identical lengths of time.)
|
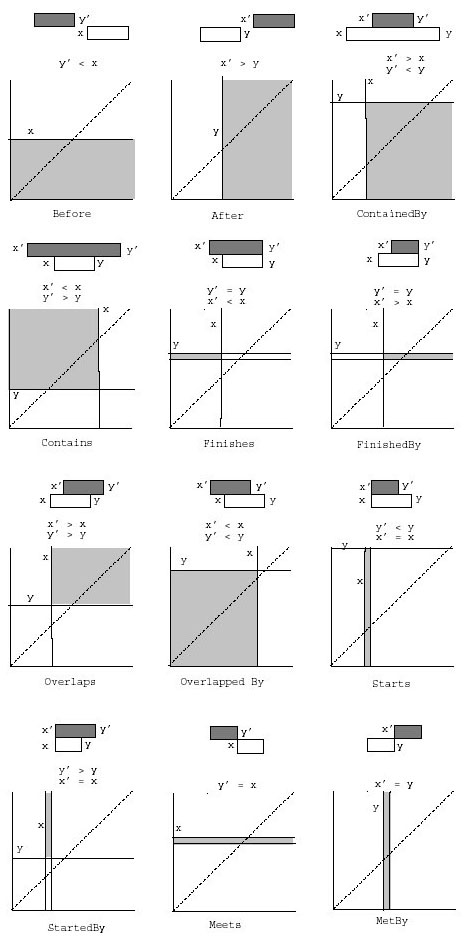
FIGURE 1: Arge illustrates 12 of the 13 interval
relationships represented as symbolic bars, mathematical equations,
and graphs. In the graph, “an interval [x’,y’] is represented as the point
(x’,y’) above the diagonal line. The gray regions represent the regions
containing the reported points/intervals” (“Efficient Object-Relational
Interval Management and Beyond,” Lars Arge and Andrew Chatham, 2003). |
| Fox, buffalo, gorilla. There’s something beautiful
about the crisp abstraction of Arge’s reality to graphic symbols; his interpretation
is not the only work of art. Nico Van de Weghe, a geography research assistant at
Belgium’s Ghent University, has adapted the notation for these 13 intervals to
include time periods with uncertain beginnings or endings — representing 16
additional relationships. Van de Weghe calls his graphic language
topological temporal symbology (see Figure 2a), because it illustrates not only
individual interval relationships, but also their overall relationship to one
another.
|
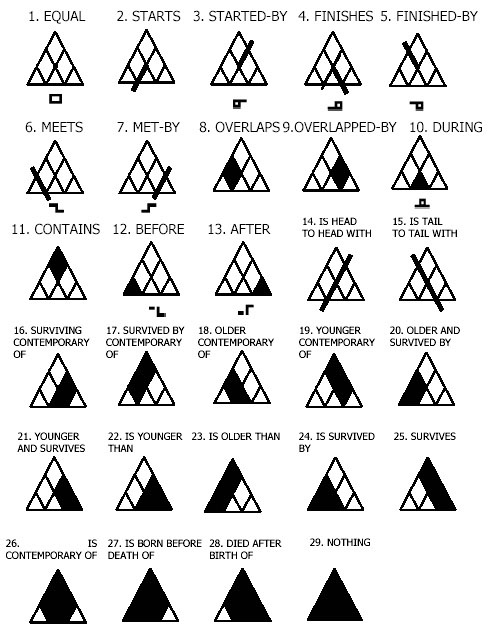
FIGURE 2a: Van de Weghe represents 29 temporal
interval cases in a |
| Van de Weghe’s symbology helps answer temporal
relationship questions, illustrated by the following simple example of incomplete
interval comparison (excerpted from a paper in preparation: “The Triangular Concept
for a Better Understanding of Temporal Information,” Van de Weghe and De Maeyer): Data. The Fox (F) was alive when the Buffalo (B) died. The Gorilla (G) was born before the Buffalo (B). Question. Could the Fox and the Gorilla have lived at the same time? Solution. In fact, they could have lived at the same time because the conjunction between the Fox–Buffalo relationship (B is survived by F) and the Gorilla-Buffalo relationship (G is older than B) is not empty (see Figure 2B).
|

FIGURE 2a: Van de Weghe’s simple
symbolization of a buffalo, fox, and gorilla’s lifespans has an underlying data
model allowing for complex spatio-temporal interval analysis. |
| Arge and Van de Weghe’s studies of temporal database queries pave the way for
applications asking questions not just about temporal intervals, but of
multidimensional (spatial and temporal) intersections. During a disease outbreak or bio-terrorism attack, for
instance, a spatio-temporal epidemiologist might want to query mixtures of known and
incomplete travel histories to discover any common infection points. Where and
when were all the infected people together? And if a disease lingers with an
infectious “half-life” in the places where carriers have been, the problem is even
more complex. Infection can then happen at the fuzzy edges of spatial and temporal
intersection. How dense? Finding clusters of points in both space and time is one of those ideas that’s easy to describe, but a little trickier to build. George Kollios, a professor of computer science at Boston University, explained how a database can answer questions such as, “Find all regions that will contain more than 500 objects, 10 minutes from now,” and “How long (for what time interval) will this answer remain valid?” Kollios and his colleagues have defined a new class of density-based queries with approximate, online techniques that answer them efficiently. As part of their multiqueries, users can specify the threshold above which a region is considered to be dense. The results list all candidate dense regions at any time in the future. The researchers’ technique subdivides the spatial universe using a grid and limits queries within a prespecified time horizon (see Figures 3a and 3b).
|
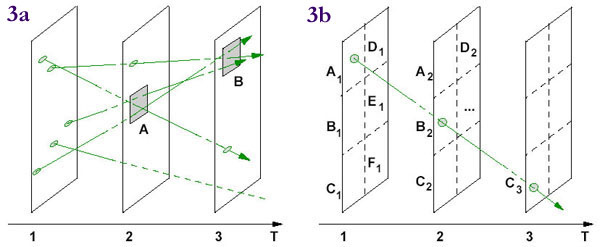
FIGURES 3a and 3b: (a) Kollios models trajectories
of objects moving in both space and time; each rectangular plane is a time slice.
Placing trajectories in a space-time grid gives the database a framework for analysis.
Here (b), the trajectory of the object inserted at time T = 1 will cross cells A1, B2,
and C3. |
| Feeling a little dense? Don’t worry; the paper (and code!) to implement the technique
yourself are available online. The title is “Online Discovery of Dense Areas in
Spatio-temporal Databases” (Hadjieleftheriou, Kollios, Gunopulos, Tsotras, 2003).
|
| 1. Introduction and Glossary 2. Whether, Not When 3. Practical Theory 4. Future Directions |
|
|