
|
This article originally appeared in Geospatial Solutions Magazine's Net Results column of July 1, 2003. Other Net Results articles about the role of emerging technologies in the exchange of spatial information are also online. |
| 1. Introduction and Glossary 2. Naive to cynical 3. Cynical to critical 4. Pure Critics | |
| From naive to cynical Mark Monmonier’s classic, How to Lie with Maps, has plenty of examples of cartographic propaganda in which a government or advertiser wants to fool the public with a map. But in his chapter on “Data Maps,” specifically choropleth census maps, Monmonier warns the reader against self-inflicted statistical blundering: “…because of powerful personal computers and ‘user-friendly’ mapping software, map authorship is perhaps too easy, and unintentional cartographic self-deception is inevitable.” Edward Tufte, in Visual Explanations, alerts readers to similar statistical mapping pitfalls in his review of Dr. John Snow’s discovery of contaminated water as the transport agent for cholera in 1854. Using Snow’s methods as a gold standard, Tufte states, “It is easy now to sort through thousands of plausible varieties of graphical and statistical aggregations — and then to select for publication only those findings strongly favorable to the point of view being advocated.” Snow, Tufte points out, did the opposite; beginning with a good idea (bad water transmits cholera), he placed the data in an appropriate context for assessing cause and effect, made quantitative comparisons, considered alternative explanations and contrary cases, and assessed possible errors in the numbers reported in his graphics. Tufte and Monmonier’s high-level summaries of spatial statistical methods are excellent preliminary guides to the ESDA landscape, but beware — the ground-level details of this territory are not easily navigable by the casual tourist. ESDA projects often require experimental pre-filtering of rogue records (outliers) or adjusting the entire dataset against a mean, standard deviation or other statistical baseline (using techniques such as smoothing). Though the larger agenda in such projects may make sense, the analytical details and their underlying statistical theory can quickly become mathematically daunting to the uninitiated. In fact, there seems to be a large conceptual gap between basic ESDA, such as creating quantile maps or setting class breaks in a histogram, and all other ESDA, such as understanding the refinements of smoothing or spatial autocorrelation. The Yoda of ESDA. Since the first appearance of digital mapping, software vendors and academics have been trying to close this gap, sometimes in partnership with each other. Luc Anselin, a professor at University of Illinois, Urbana–Champaign’s Department of Agricultural and Consumer Economics, directs the CSISS and has recently released a free software tool called GeoDa. Through a simple, user-friendly Windows interface, GeoDa provides linked map and graph tools for ESDA of lattice data. Anselin’s definition of lattice data is “…discrete spatial units that are not a sample from an underlying continuous surface (geostatistical data) or locations of events (point patterns)” — in other words, data such as polygonal census data. GeoDa’s maps and statistical graphics, such as scatterplots, respond in unison to user selections, allowing researchers to exclude extreme data points from a graph (which automatically replots itself) and simultaneously see these outlier locations on a linked map. Users can manually “brush” a map or graph with a small mobile bounding box to select a subset of data on the fly. As they float the box over different regions, the slope of linked scatterplots tilts to match the replotted data subset (see Figure 1). |
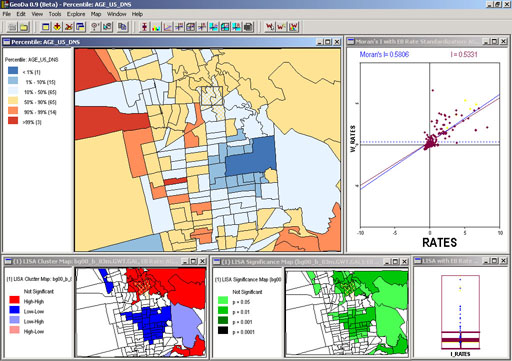
Figure 1: Geoda maps and graphs of Berkeley, California comparing density of children under 5 years old to renter-occupied housing per census block group. As the user moves a selection box across the map, the linked Moran scatterplot and LISA chart show the selection and replot accordingly. The University of California campus and its surrounding absence of babies is an obvious cluster. |
| Whereas previous versions of GeoDa’s tools were extensions to ESRI’s (www.esri.com) ArcView
software, the current offering is freestanding and does not require a specific GIS system.
However, GeoDa does rely on ESRI’s shapefile as the spatial data storage standard and on ESRI’s
freely distributable MapObjects LT2 technology for spatial data access, mapping, and querying.
The statistical analysis components are C++ code written by Anselin’s group. Geoda will soon
be available in the Python programming language as well. The stats on GeoDa. Not an all-purpose GIS tool, GeoDa’s tight focus is part of its appeal. The available functions are mapping (standard choropleth maps, outlier maps, animated map movies) smoothing rate maps (raw rate, excess risk, empirical Bayes, spatial rate, spatial empirical Bayes), statistical graphs (histogram, box plot, and scatter plot), linking and brushing, spatial weights (contiguity, distance band, k-nearest neighbor), and spatial autocorrelation (univariate and bivariate Moran scatterplots and Moran scatterplot matrix, bivariate and multivariate LISA). GeoDa’s user-friendly interface and accessible ESDA functions perfectly fit Monmonier’s description of a potentially self-deceiving tool when in the hands of the awestruck and naive (I couldn’t wait to test it out and feel the rush of awe!). Learning to manipulate GeoDa’s tools takes at most an afternoon, but grasping the underlying statistical principles requires more devoted academic commitment. Anselin seems well aware of the educational needs accompanying his software; the CSISS website (www.csiss.org) has a section devoted to “Learning Resources” with a reading list, presentations, video clips, and CSISS Classics (recommended). In addition to his own published work, Anselin recommends Bailey and Gatrell’s Interactive Spatial Data Analysis, and Fotheringham, et. al.’s Quantitative Geography, Perspectives on Spatial Data Analysis as introductory ESDA texts.
|
| 1. Introduction and Glossary 2. Naive to cynical 3. Cynical to critical 4. Pure Critics |
|
|