
|
This article originally appeared in Geospatial Solutions Magazine's Net Results column of June 1, 2003. Other Net Results articles about the role of emerging technologies in the exchange of spatial information are also online. |
| 1. Introduction and Glossary 2. Who's Zoomin' Who? 3. Public Science 4. Cast of Thousands | |
| Public Science The enterprise is not the only venue for collaborative spatial Web sites. Consider also a grassroots example. California’s central coast is the hunting ground for a disease called SOD, caused by a funguslike pathogen that penetrates trees’ cambium (water-transport) system and chokes their canopy of water. Within six months, diseased trees’ leaves discolor. A year or more later, the tree dies. SOD kills coast live oak, tanoak, California black oak trees, and Shreve oak, and continues to spread through central coastal California. When Dr. Maggi Kelly of the University of California, Berkeley (www.berkeley.edu) began working with SOD researchers in 1999, she recognized an opportunity to extend university activities to the public and other external groups. There were plenty of concerned parties to unite, including the research community, homeowners, naturalists, recreationists, park officials, rangers, open-space managers, and local government and natural resource managers. Convinced that the Internet would be a valuable tool in such a collaborative effort, Kelly searched for Web sites attempting to bridge the gulfs between scientific monitoring and public communities. She discovered several approaches that helped close the gap, though none were unified in a single Web site. Disparate ingredients. One such approach (needing no justification to readers of Geospatial Solutions magazine!) is the presentation of monitoring results in a geographic format — in other words, a Web site with interactive maps that deliver scientific analysis in a publicly digestible graphic format. Other sites, such as the SurfRider Foundation’s (www.surfrider.org/feedback/watchdog.htm) allow Web users to submit their own monitoring reports, bringing public observations to the scientists. However, the SurfRider’s site has no map or interactivity. A USGS site titled “Did You Feel It?” (pasadena.wr.usgs.gov/shake/ca/) has both maps and user input. The site allows the public to report earthquake intensity following major seismic events, then maps “Community Internet Intensity.” The site lacks only the ability to query the dataset. Synthesizing these discoveries, Kelly’s team built a Web site for SOD that combines mapping, querying, interactivity, and public participation. The result is an online monitoring application they call OakMapper web GIS (www.oakmapper.org). OakMapper’s interactive map displays diseased tree locations and zones of infestation, color coded by confirmation (see Figure 3). Data flows into the site’s database from a variety of sources including the general public, which can report their observations using a Webbased form. The form both collects data and educates potential contributors (see Figure 4). |
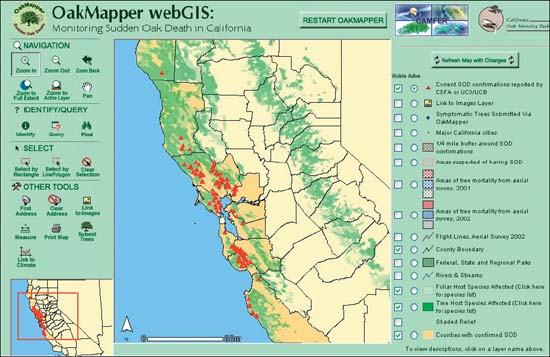
Figure 3: The OakMapper Web site displays all data, from experts and the public, color-coded by confirmation status. |
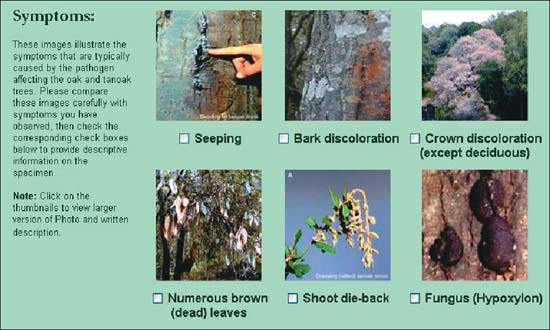
Figure 4: FIGURE 4 OakMapper’s report form not only accepts locations but educates the public about disease symptoms and tree species. |
|
Floodgates open. Online tree submission went live in January, 2001, and averaged
20 visitors per day. From this pool, visitors submit approximately five diseased
tree reports per week. Considering that official lab tests confirm 15–25
cases of SODS per month, the public input is a sizeable part of the data
contribution. UCB’s Karin Tuxen captures incoming data and automatically or manually geocodes it in near real time. In other words, Tuxen geocodes addresses as they arrive, a necessary precaution since nontechnical submitters sometimes include extended descriptions in the address bar, not just clean addresses. Even the best automated geocoder might balk at some entries. Responding to privacy concerns, OakMapper staff keep all address and e-mail completely confidential in a database independent of the online connection. OakMapper uses a “spatial estimator” that places geocoded points within a mile of the exact location, but not (in the public view) exactly on target. This anonymity protects landowners’ property values if they report diseased trees on their own land. A two-way street. Combining observations by private and public sources in a common geography has been helpful to the SOD labs at the California Department of Food and Agriculture — public observations suggest a potential distribution of the range of SOD. With so much territory to cover and so few researchers to deploy, every hint helps. Tuxen reported, “So far, public submissions generally have followed the distribution of official confirmations, though they sometimes lead to an unchecked area of that distribution, which prompts a visit by the official scientists.” Likewise, a familiarity with officially confirmed zones of infestation helps the public know that disease symptoms in their neighborhood trees are more likely to be SOD than some other similar disease. As with SFProspector, OakMapper’s successful deployment hinged on cooperation with other groups. Kelly is co-chair of the Monitoring Committee of the California Oak Mortality Task Force that maintains up-to-date distribution information about SOD and coordinates all monitoring activities between public and private research organizations in the San Francisco Bay Area and neighboring counties. There are prominent links between the task force’s main Web site (www.suddenoakdeath.org), and OakMapper.
|
| 1. Introduction and Glossary 2. Who's Zoomin' Who? 3. Public Science 4. Cast of Thousands |
|
|