 |
This article originally appeared in Geospatial Solutions Magazine's Net Results column of March 1, 2003. Other Net Results articles about the role of emerging technologies in the exchange of spatial information are also online. |
| 1. Introduction and Glossary 2. Rain or locust clouds? 3. Weather Decision Support 4. System raincheck! | |
|
Spinning points, soggy polygons The extensive coverage, localized detail, and frequent refresh rate of this nationwide array of Doppler sensors, combined with the importance of weather prediction, makes Meteorlogix’s boast of serving "more then 22,000 customers with a focus on public safety, broadcast media, transportation, energy, and aviation industries" seem reasonable. Dr. Clive Reece, GIS products manager for Meterologix, explained the company’s history as follows:
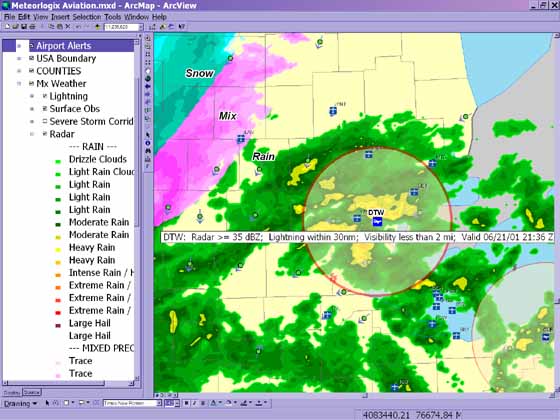
We’re the merger of three weather companies: DTN Weather Services focused on real-time satellite delivery, Kavouras out of Minneapolis focused on media weather graphics and high-end display (such as an SGI workstation) of weather for television stations, and Weather Services Corporation out of Boston focused on long-term climatology prediction. We were brought under one umbrella [forgive the pun!] about two years ago. One of our business initiatives has been weather-enabling GIS. We began by taking our primary workstation product that received satellite information and created graphics, and added operational conversion routines to produce point and polygon shapefiles of our real-time weather feed. Since then, the business has expanded to GIS-based automated weather decision-support systems and custom services. Meteorlogix has discovered that the GIS community wants Internet access. Most users, says Reece, "don’t want to punch a hole through their roof and put a satellite feed in." Consequently, Meteorlogix is expanding its options to include Internet delivery, providing weather shapefiles through FTP and ESRI (www.esri.com) ArcIMS image and feature services. Satellite delivery, with its timely and reliable data stream that remains free of Internet traffic, still remains the best choice for more mission-critical applications in public safety and transportation, however. Whether with weather -- decision support applications Organizations that integrate weather services data into their spatial systems want to know local weather conditions in either the present, the future, or both. The rain in Spain (on the plain!). For weather conditions right now in a specific location, the Meteorlogix feed is accurate to within 5 or 10 minutes, depending on the kind of data required. Organizations such as the military or utilities that require an accurate field response stand to benefit. Likewise, awareness of real-time storm tracks improves routing, logistics coordination, and operating efficiencies for local and national transportation systems. The efficiencies can be realized in more-precise air traffic routing around rapidly changing weather and the transport of hazardous materials around electrical storms and high-wind events (See Figure 3). For instance, trucking companies want to protect their property and personnel, but also want to keep whatever they’re transporting moving as fast as possible. Adding meteorlogical data to the balance sheet of a delivery more accurately accounts for the time lost when avoiding weather that might damage cargo or hurt personnel.
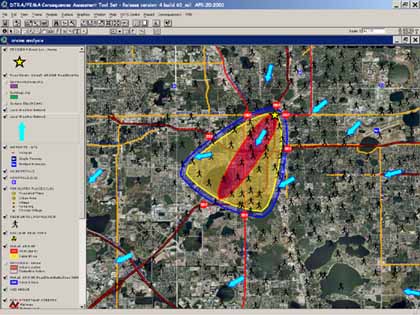
Red sky at morning? Forecasting the weather is an age-old practice seeing sharp rises in sophistication thanks to technological convergence of data and models. Homeland security managers, for instance, can now integrate wind data and 3D building data with plume dispersion models to create timely and highly accurate projections of airborne concentrations of chemical gases from accidents or terrorist attack (see Figure 4).
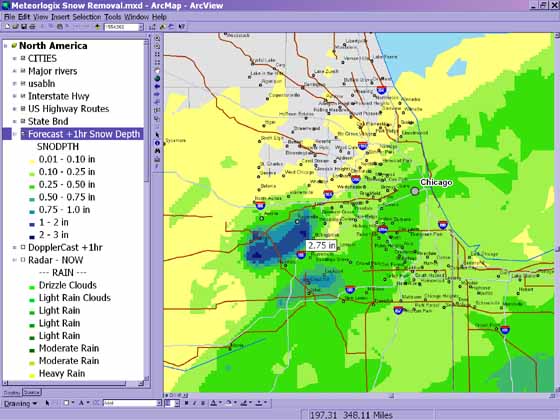
Forecasting seems to touch almost every spatial industry vertical market. Emergency responders and city planners can use radar-derived rainfall information to increase the accuracy of water management and flash flood forecasting, estimating not only how much water will accumulate, but where it will fall. Insurers can use forecasts to analyze potential storm damage before a hurricane hits their customers’ region (in some cases using historic records of storms as a qualifier). Some NEXRAD data feeds calculate areal amounts of rainfall in one hour, three hour, and 24-hour time periods. When input into hydrologic flood models as polygons, these data predict which watersheds are at risk of flooding. Even the spatial industry itself can use forecasts of cloud cover to schedule remote sensing activities more intelligently. And there’s a payoff. For instance, cities in cold climates have considerable budgets for snow removal, including putting chemicals on the roads and deploying plows strategically around town. Defining a threshold, for instance, of 0.5 inches of snow, allows their system to sound the alarm when snowplows should begin plowing combining forecast, areal extent of fallen snow, and the amount and the timing of snowfall with crew schedules and availability can help dispatchers decide when to call more people in, and where to deploy the trucks. Inadequate response to an unexpectedly heavy snowfall, on the other hand, can exact not only a financial, but a political toll, as happened last year in a Chicago blizzard (see Figure 5).
|
| 1. Introduction and Glossary 2. Rain or locust clouds? 3. Weather Decision Support 4. System raincheck! |
|
|