 |
This article originally appeared in Geospatial Solutions Magazine's Net Results column of March 1, 2003. Other Net Results articles about the role of emerging technologies in the exchange of spatial information are also online. |
| 1. Introduction and Glossary 2. Rain or locust clouds? 3. Weather Decision Support 4. System raincheck! | |
|
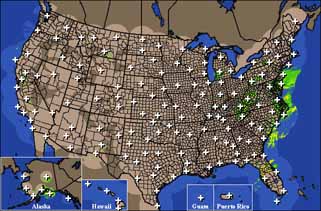
Nourishing rain clouds or seasonal locust clouds? Meteorlogix offers two main benefits to its customers: synthesis and conversion. Meteorlogix shapefiles are a result of data derived from a variety of sources. For instance, lightning strike locations come from Vaisala-GAI, Inc. (www.vaisala.com), a manufacturer of lightning detection equipment. Wind speed and tornado detection come from NEXRAD. Following acquisition, Meteorlogix interprets the data and converts it into shapefile format. The deceptively simple result, color-coded areas and point symbols on the GIS desktop map, conceals a chain of sophisticated sensor and data delivery technology. Consider the radar feeds, for instance. NEXRAD measures both precipitation and wind using Doppler radar technology, named after the Austrian physicist, Christian Doppler. The radar emits a short, directed pulse of energy that scatters in all directions upon collision with such objects as raindrops, snowflakes, birds, or even ocean waves. A small but measurable portion of that scattered energy bounces back to the radar, which then analyzes the strength of those reflected signals, the time they took to travel to the object and back, and the frequency shift of the pulse. The frequency shift, or "Doppler effect," reveals the objects’ velocity, either toward or away from the radar. If measuring the wind speed at a location 90 miles from the sensor seems hard to believe, consider your own biological sensors and their similar in-house calculation skills. For instance, as a fire engine screams past you, you may have noticed the siren’s pitch changing from high to low. As the fire truck approaches, the siren’s sound waves are compressed, making the pitch higher than if the truck was stationary. Likewise, as the truck moves away from you, the siren’s sound waves stretch out and their pitch lowers. The faster the fire engine moves, the greater the variation in its siren’s pitch as it passes your location. Measuring this Doppler effect to "see" the wind is what enables NEXRAD to detect the formation of tornados and the National Weather Service to issue advanced notice tornado warnings. Weather almost everywhere. The NEXRAD system is a joint effort of the DOC, DOD, and DOT. The controlling agencies are the NWS, AWS and FAA respectively. There are 159 NEXRAD sites throughout the United States and selected overseas locations, such as Guam. Due to variations in topography and station location, relatively small areas of the United States fall outside radar range, but most areas have continuous coverage (see Figure 1).
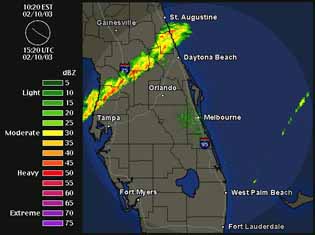
The National Weather Service's Doppler radars can detect most precipitation (though not always light rain, light snow, or drizzle from shallow cloud weather systems) within a roughly 90-mile radius, and intense rain or snow within approximately 155 miles. A familiar sight on the nightly television weather report, NEXRAD data can be color coded to show precipitation or wind intensity (see Figure 2).
It’s easy to underestimate the sensitivity of NEXRAD, which commonly detects not only rain and snow, but also aircraft, birds, insects (birds during migration periods, and swarms of insects in summer). The stations send out pulses at multiple angles every 5 or 10 minutes, to capture changing meteorlogical conditions in vertical as well as horizontal dimensions. (See www.ncdc.noaa.gov/oa/radar/radarresources.html and www.wunderground.com/radar/help.asp for additional NEXRAD details.) From satellite feeds of this multidimensional data, Meteorlogix produces its shapefiles. |
| 1. Introduction and Glossary 2. Rain or locust clouds? 3. Weather Decision Support 4. System raincheck! |
|
|